Recipe economics
What does this item cost to make?
Connect the selling price to the ingredients and recipe costs behind it.
Decision to examineReview the recipe or pricing assumptions.
Kafili / Product Design / Early-stage
From fragmented financial data to clearer operational decisions for cafe owners.

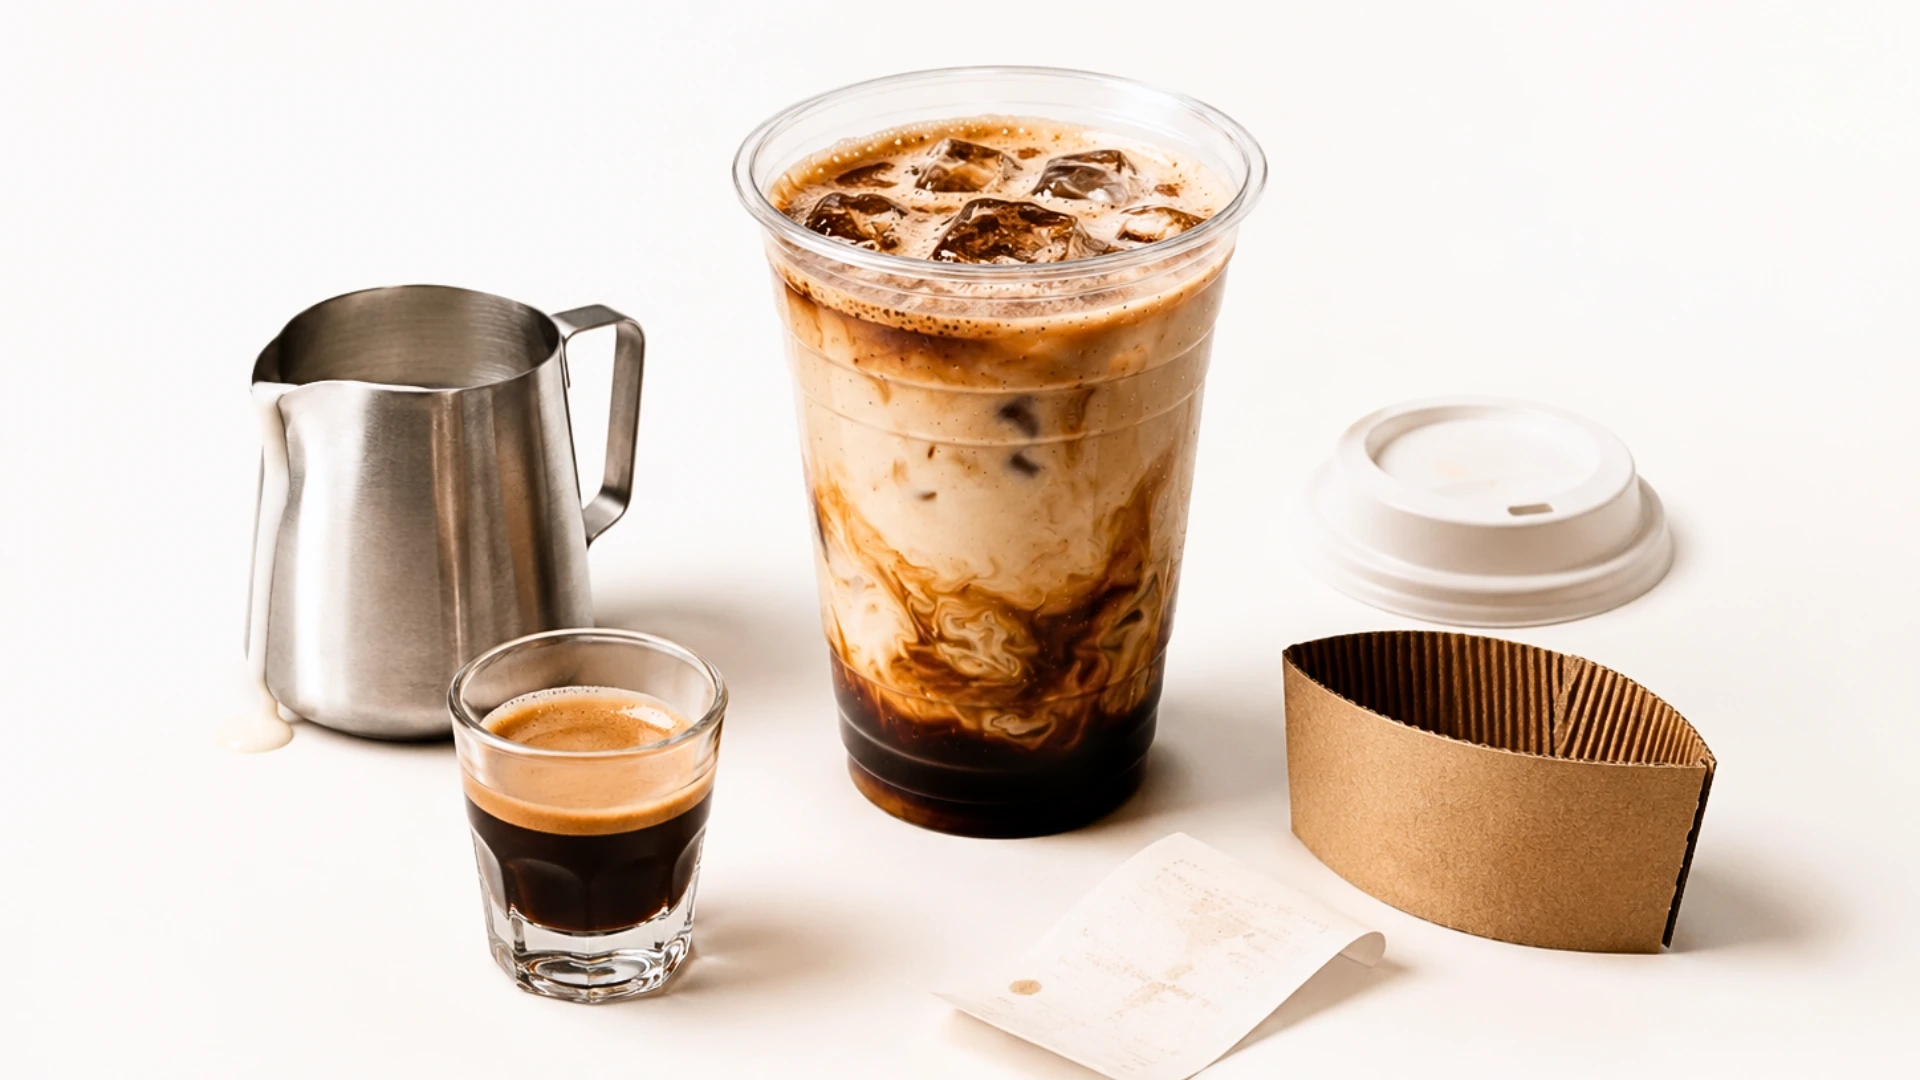
The design journey
Spreadsheets, recipes, costs, and sales channels.
Understand how costs and allocation affect the picture.
Help owners see what deserves a closer look.
A summary of the product-design process, not a product screen or a measured outcome.
The starting point
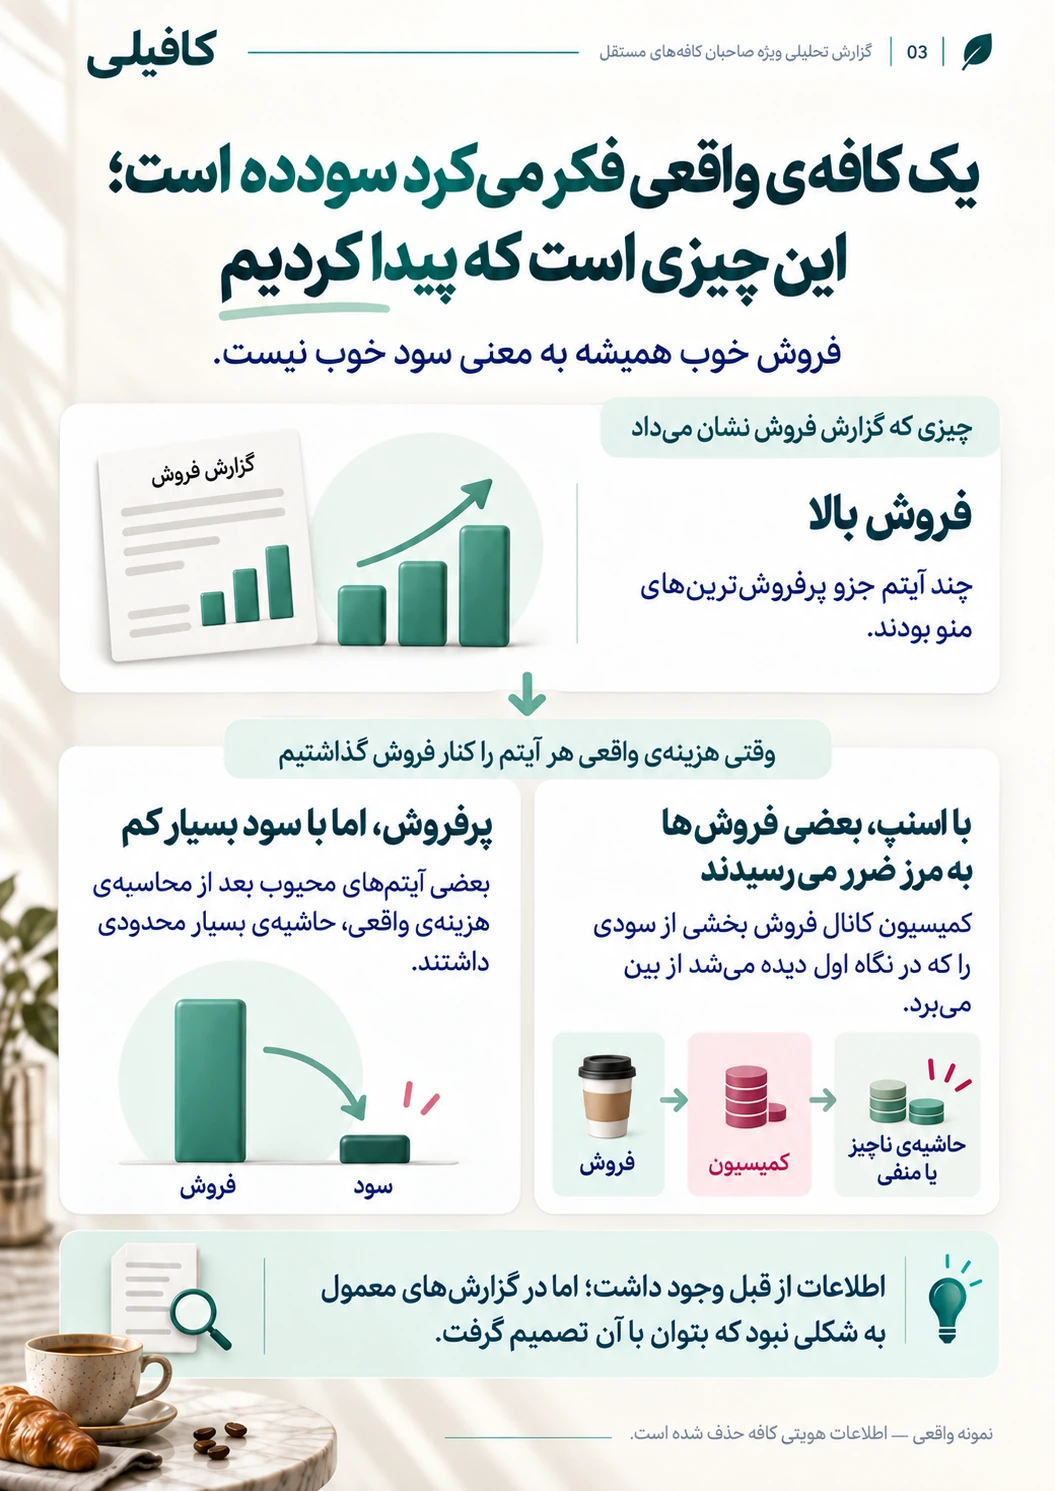
Kafili is an early-stage cafe profitability analytics product. My starting point was a real cafe's financial and operational data: understanding how its recipes, costs, sales channels, and overhead fit together. A busy service or a strong sales total alone could not explain what the business kept.
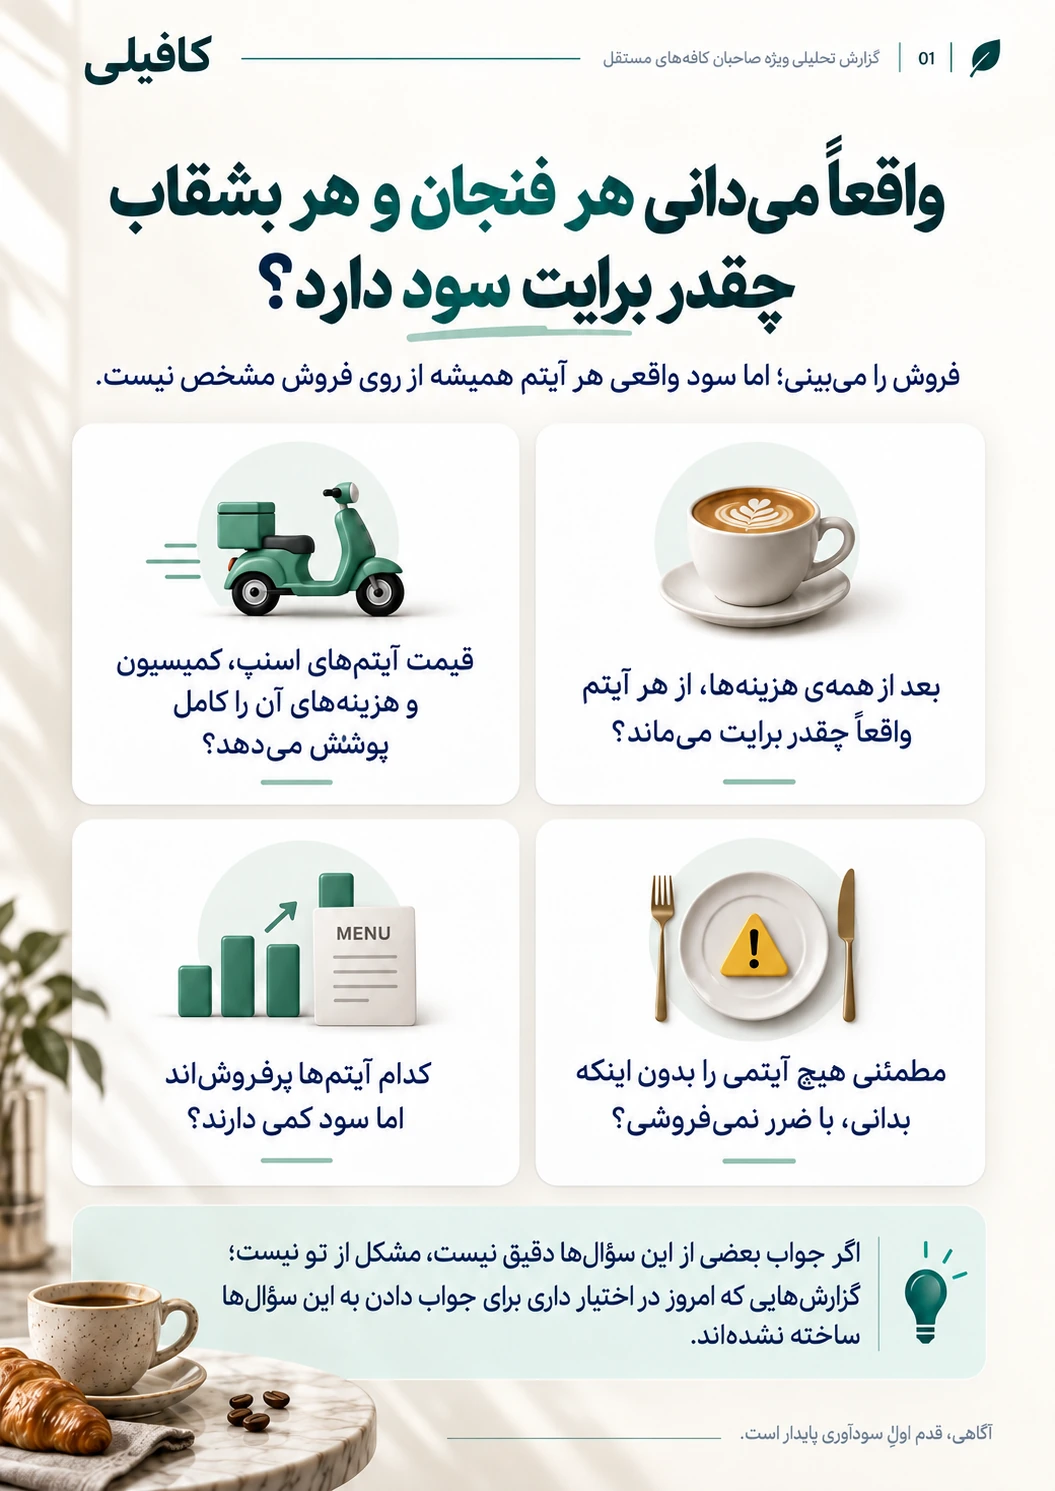
Understanding the data
I worked through fragmented financial spreadsheets to understand the relationships between ingredients, recipes, costs, and sales. My contribution was to connect those pieces into a product view: what an owner needs to understand, which costs belong in a comparison, and where missing context can make a number misleading.
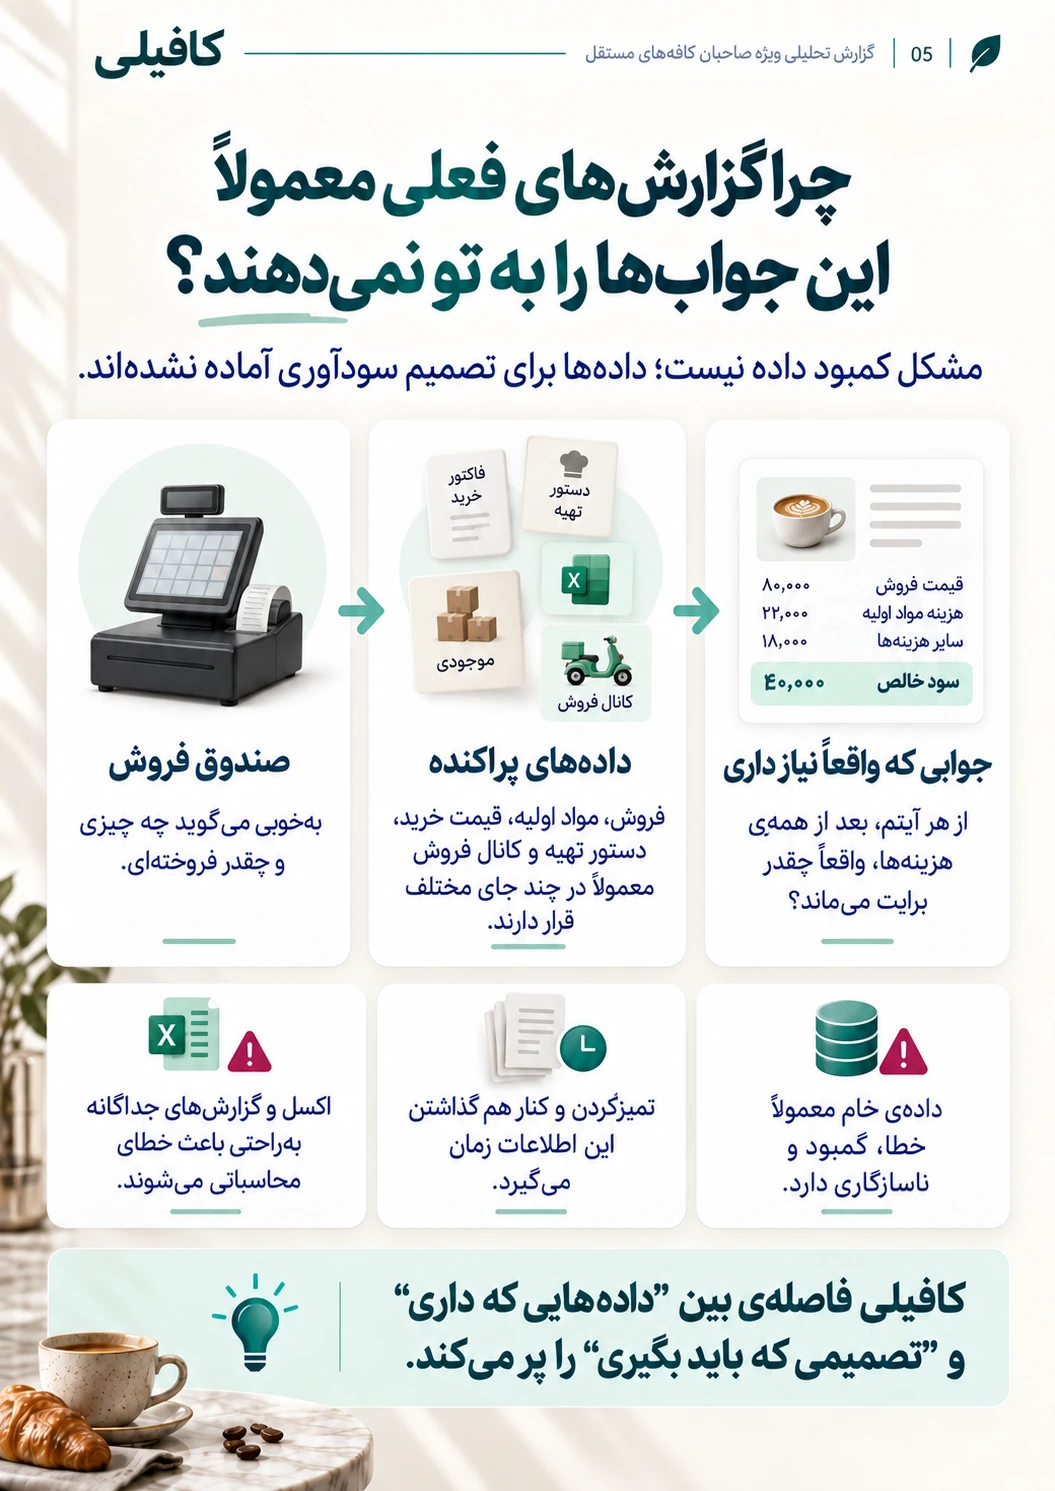
Finding the hidden questions
I analyzed recipes, costs, and sales channels to identify profitability problems that sales volume could obscure. This meant looking beyond an item's selling price: considering its recipe cost, the channel it sold through, and how overhead was allocated. The public story explains that analytical lens without exposing the cafe's figures or claiming a quantified loss or saving.
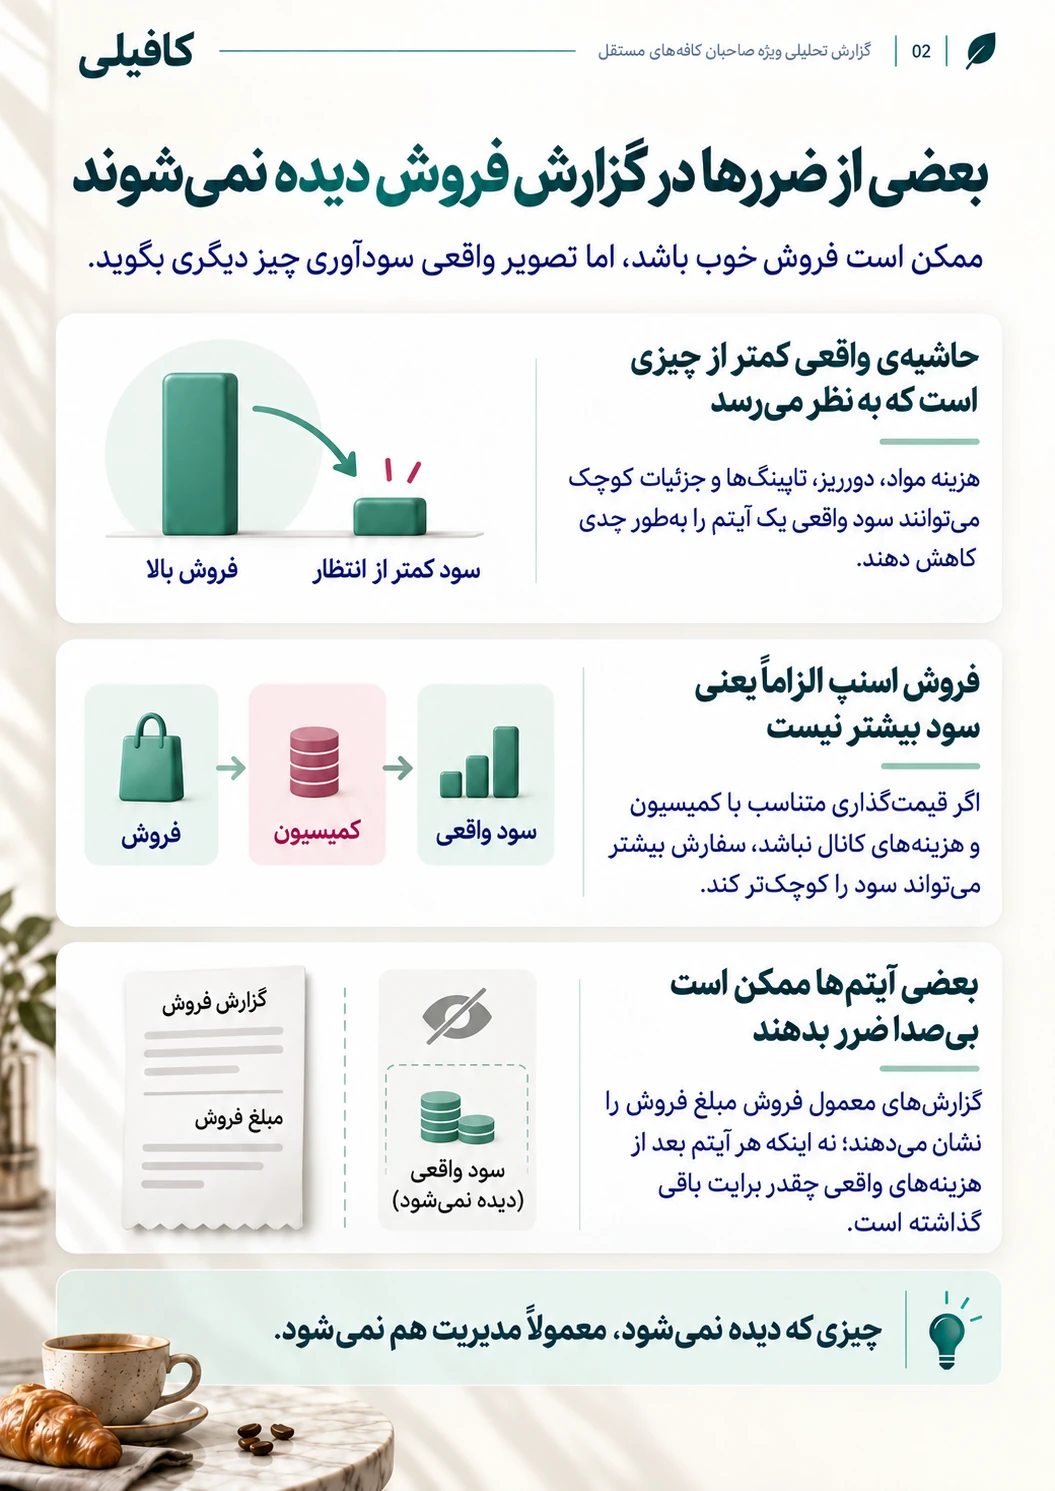
Defining report UX
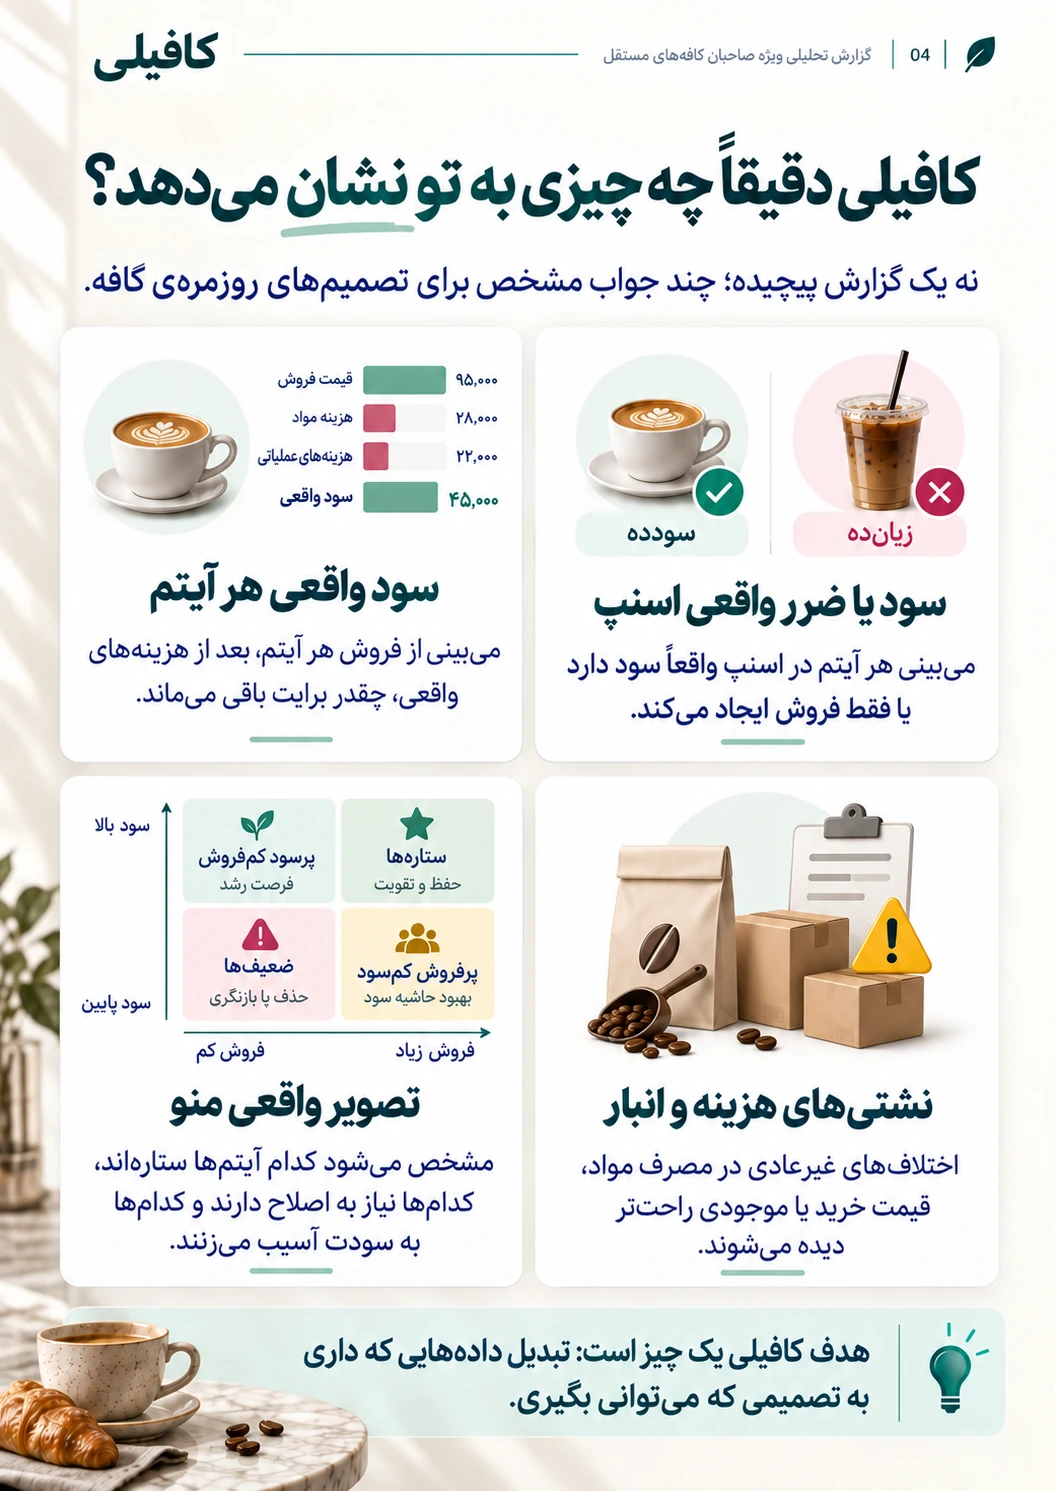
I translated the spreadsheet complexity into a direction for owner-facing reports. The focus was a readable path from a profitability question to the costs and assumptions behind it, then to an operational decision worth examining. A useful report needs to explain its basis as clearly as its headline.
Report direction: questions to support, not validated recommendations or findings from the cafe.
Recipe economics
Connect the selling price to the ingredients and recipe costs behind it.
Decision to examineReview the recipe or pricing assumptions.
Sales channels
Make channel-related costs visible when comparing sales.
Decision to examineExamine the economics of the channel mix.
Overhead allocation
Distinguish recipe-level economics from a view that includes shared operating costs.
Decision to examineCheck the allocation before drawing a conclusion.
Product direction
My work helped define Kafili around translating financial analysis into actionable insights for cafe owners. Recipe economics, channel differences, and overhead allocation shaped the questions the product should answer. The report structure and product direction remain part of an evolving exploration, rather than a finished, validated reporting system.
Still evolving
Kafili is still evolving. The work presented here is my contribution to understanding real operational data, identifying profitability questions, and defining product direction and report UX. It does not establish product adoption, improved cafe profitability, or measured business impact. The next question is whether owners can understand the reports, trace the assumptions, and use them to decide what to investigate.